Synthos Research · The Synthesis · No. 1
Is the semiconductor flash crash over? · Wednesday, August 12, 2026 · what broke in July, nine dated calls on our ledger, the memory-versus-GPU collision, and a CPI print that resolves as you read · 10-minute read
The S&P 500 sits within a third of a percent of the record close it set Friday. Every semiconductor name that powered its year is still 7.7% to 39.8% below its own peak — and nine of the eleven we track are lower now than they were when that record was set. That gap is the story of this market, and our read of it is the headline: July's crash broke balance sheets, not businesses — and the two heal on different clocks. Everyone with a microphone has an answer for how the gap closes. Nine of those answers are dated and falsifiable, and they are on our ledger — from “new all-time highs by year end” to “the starting gun of a bear market” — while the sector's loudest bull is, by his own disclosure, rotating money into silver even as he tells everyone else to stay. One call on the ledger resolves while you read: this morning's CPI print.
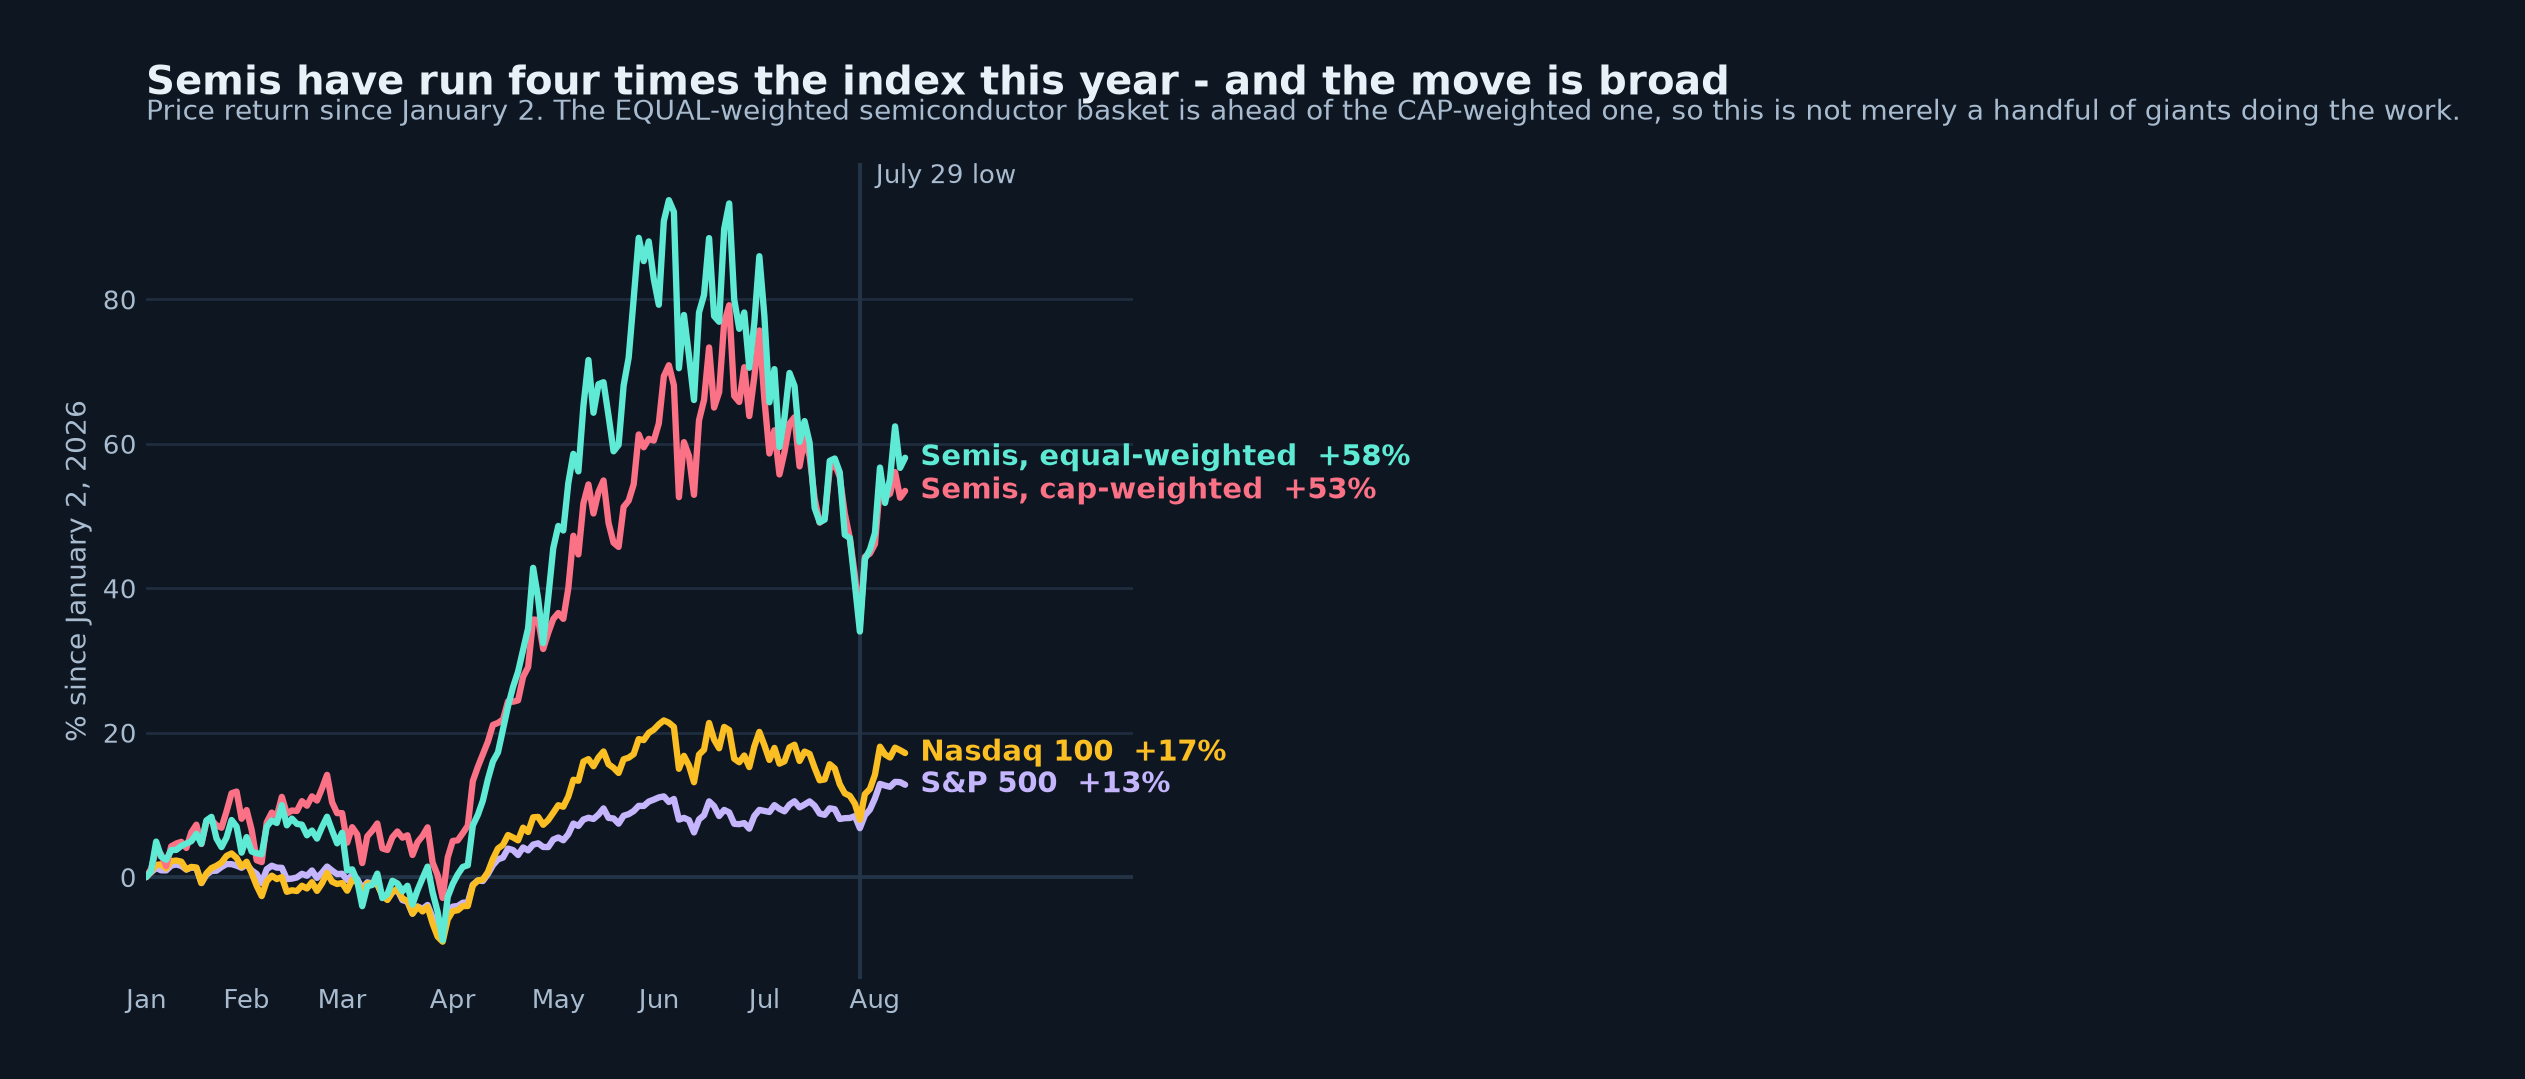
The whole episode in one frame: the year's run, the July break, and the bounce. Price return since January 2, 2026, to the August 11 close; numbers repeated below in case images are blocked for you.
| Series | Year to date |
|---|---|
| Semis, equal-weighted (XSD) | up 58.1% |
| Semis, cap-weighted (SMH) | up 53.5% |
| Nasdaq 100 | up 17.2% |
| S&P 500 | up 12.8% |
The equal-weighted basket is ahead of the cap-weighted one. Whatever happened here, it happened to the whole sector, not to a few giants.
It surprised us — the expectation was that the largest names were doing the lifting, and the data said otherwise. Weight every semiconductor company the same and the year's return is 58.1%; let the biggest dominate and it is 53.5%. It matters for the question this letter is built around — is the flash crash over? — because a broad advance that breaks and a narrow one that breaks are different animals: the crash we are about to dissect hit an entire sector's worth of businesses, not a story stock or two.
1How it broke: the timeline of a forced seller
The headline's claim is a conclusion, and the evidence for it is a timeline. Assets in 3x leveraged ETFs had climbed from roughly $25–30bn to $100bn — a tripling-plus in the most fragile instrument retail can buy, a figure Quinn flagged on Forward Guidance, and one of a cluster of speculative behaviours (one-day options, levered ETFs, sports betting) that had Bill Ackman counselling caution by early August. Korea's KOSPI then fell about 40% in a cascade of margin calls — an unwind of a rise built on Samsung, SK Hynix and essentially one product, RAM, which only three firms in the world make at scale, and which had tracked earnings closely enough that Lyn Alden judges the underlying trend “sustainable though volatile.” Then the concentration broke at its most crowded point: Situational Awareness, a widely copy-traded fund of around $45bn, was force-liquidated into Citadel — the worst four-day crowded-position unwind our sources have seen. And then, on July 29, it simply stopped: nine of the eleven names we track printed their low on the same day. Eleven companies do not discover eleven separate problems on one afternoon. Forced sellers run out of things to sell.
The timeline gives the tinder. It does not explain the spark, and the sharpest account of that in our store comes from the macro seat rather than the AI trade: with inflation falling and Kevin Warsh's Fed staying hawkish by saying nothing, real rates rose fast — and a fast-rising real rate is precisely what breaks levered momentum books. That is Andreas Steno's August 3 reading (on Macro Mondays, interviewed by Mikkel Rosenvold), and the mechanism holds together: he called the result the “stupidest market he can recall” — solid names with nothing but good news through July, sold anyway — and a gift if you were not levered. Which is the timeline's point restated: the sellers were forced, and the unforced saw opportunity.
Why was it so fast? The framework we lean on most this year says speed is now structural: AI compresses economic time — things that took a decade take a year — so terminal value, most of what any growth stock's price actually is, gets harder to estimate, multiples compress, and re-pricing happens in violent bursts rather than drifts. That is Jordi Visser's framework, dated August 2, and it comes with parameters we can test: a volatility regime shifted from 5–15 to 15–30 with no mean reversion, and hedge fund leverage capped below this year's highs because prime brokers won't extend it again.
Three mechanisms, one crash: leverage was the tinder, rising real rates the match, compressed time the accelerant. Nothing in that sentence is about earnings — which is the point.
2The earnings evidence never cracked
If the crash had been about the business rather than the balance sheets, the business data should show it. It does not — yet. The drawdown's stated rationale was that AI companies were over-earning on cheap compute: margins gifted by a supply glut, due to deflate at renewal. The renewal data points the other way. A top startup that rented a several-thousand-GPU cluster at roughly the mid-$2 range per GPU-hour expects to pay just under $4 seven months later; one inference cloud expects 100% more. Contracted compute sits at a large discount to spot, so it reprices upward as it rolls — the signature of companies under-earning on a scarce input, not over-earning on a cheap one. That evidence comes from Gavin Baker, who went hunting during the worst week of the unwind for any metric that said the build was rolling over — GPU availability, rental pricing, spot DRAM, token growth — and reported that he “could not find a single negative quantitative AI metric all week.” Cloud operating cash flow growth accelerating from 28% to 32% and NVIDIA at its lowest forward price-to-earnings multiple in ten years sit under the same heading.
Two independent checks, from outside the AI trade, point the same direction. Korean semiconductor exports are running up roughly 160% year over year while forward pricing implies the export trade flatlines to zero growth — “the one scenario that won't happen,” in Steno's August 11 phrase, and his is a case grounded in customs ledgers, not narratives. And the buyers are not retreating: after strong earnings and raised guidance, the hyperscalers are expected to keep raising capex for another quarter or two. Demand-side arithmetic leans the same way — only a few hundred thousand people yet use AI the way it will eventually be used, running fleets of sub-agents, and the compute question is what happens when that becomes 1% of the world, then 100 million, then 500 million (“There will never be enough compute, ever,” as Visser puts it, citing Elon Musk's figures of memory demand growing 200% a year against capacity growing 20%).
The crash was priced as an earnings problem, and the earnings evidence says it was not one. What would change that reading is specific: renewals rolling flat instead of up, cloud cash-flow growth decelerating, or the Korean export series breaking. None has happened. None of it says prices must therefore recover on any particular clock, either — balance-sheet damage has its own timetable.
3The scorecard: the bull who raised his bid three times
The most instructive record on the board this week belongs to Jordi Visser, because it moved three times in seven days: August 2, the unwind was probably a cleansing bottom — “but no racing back up”; August 8 (interviewed by Anthony Pompliano), “the lows are in for the AI names; by the end of the year we'll be at new all-time highs for many of them”; August 9, “the speed crash is over and the bottom is in on a probability basis.” A forecaster raising his bid while his sector slides is either early or wrong. The August 8 interview came with the book disclosed, so here is what went on the ledger, each entry to be graded on its own clock:
| The call, as logged | Its clock |
|---|---|
| Marvell — stated top pick, “most focused on the optical names” | year end |
| NVIDIA — a good-sized disclosed holding, “it's cheap” | year end |
| Micron — exiting, not adding | the 2027 memory cycle |
| Silver — buying again with the Micron proceeds | first test: September Fed meeting |
| Gold — “breaking out,” the stated reflation trigger | first test: September Fed meeting |
| Bitcoin — the other rotation destination | same, amplified (section 4) |
One disclosed book, two theses: acceleration in the AI names, reflation in the metals — and a memory exit that collides head-on with the week's strongest macro argument.
Read the book against the words. The same interview that promises the AI names “an extra 15% over the S&P” is rotating a memory position into silver and Bitcoin. Both can be right — the metals lean on the reflation case in section 4, the AI names on the year-end call — but they rest on different assumptions, and the Micron exit in particular runs straight into the memory argument below.
The damage, name by name — prices to the August 11 close:
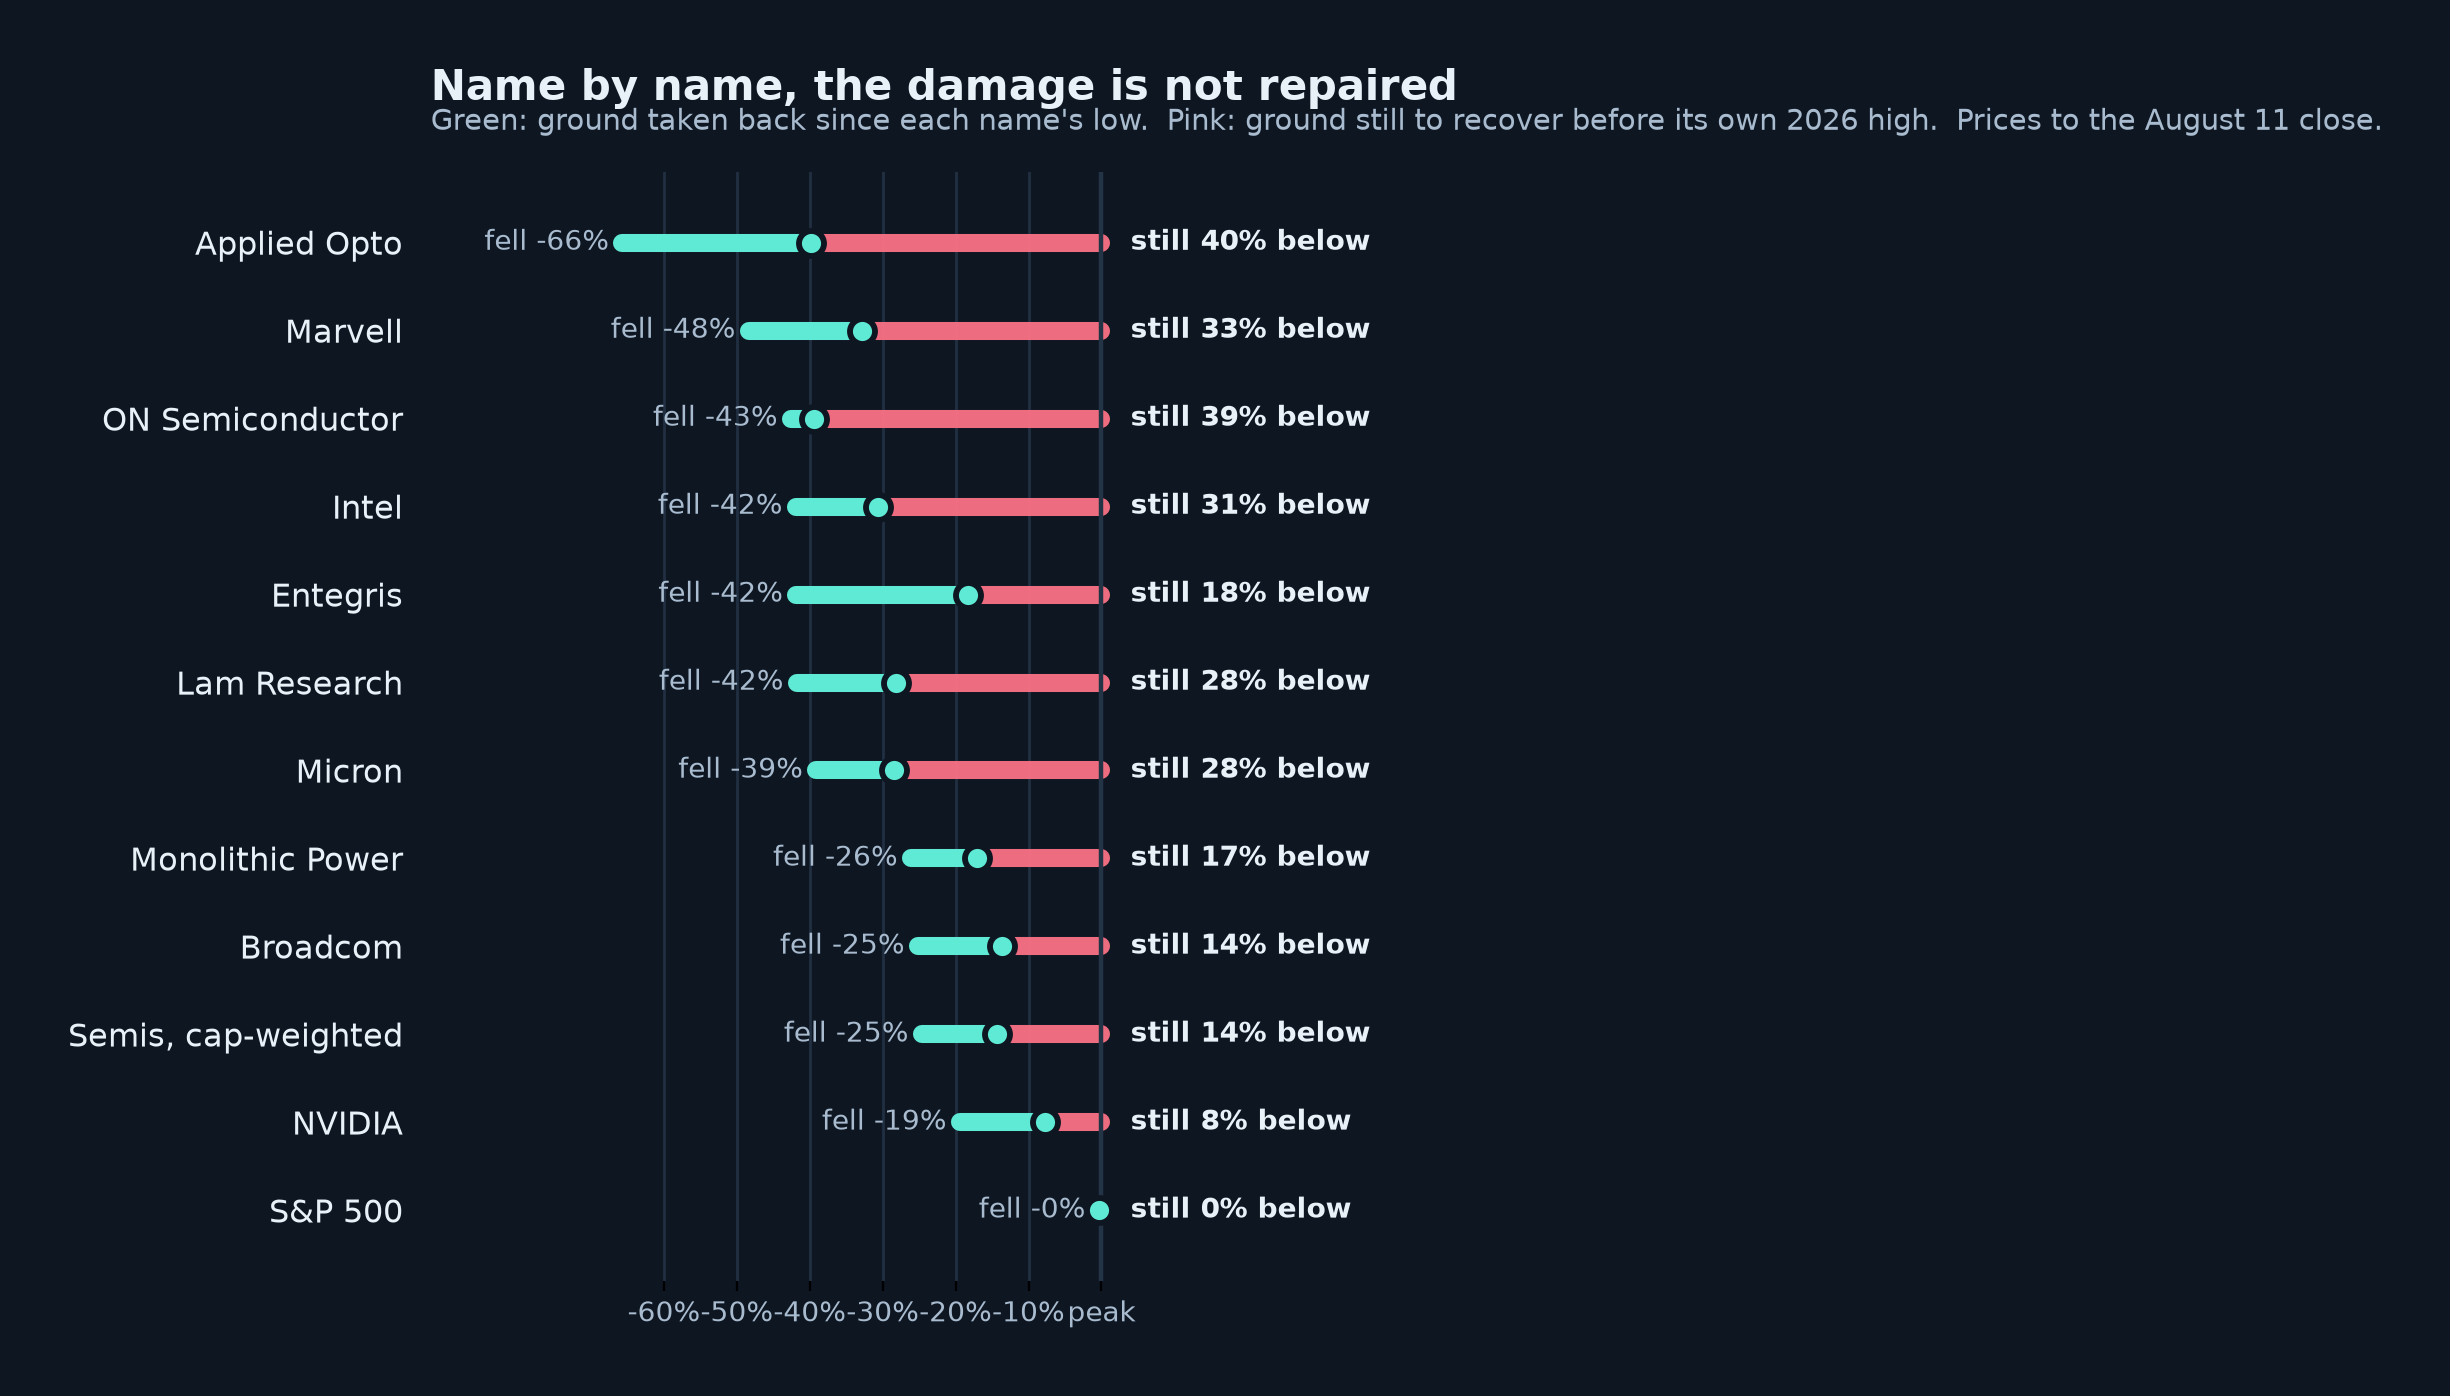
The fall from each name's own 2026 peak, and how much has been taken back as of the August 11 close. Full numbers below.
| Name | Fell | Taken back | Still below |
|---|---|---|---|
| Applied Opto. (AAOI) | down 65.7% | up 75.5% | down 39.8% |
| ON Semiconductor | down 42.6% | up 5.5% | down 39.4% |
| Marvell | down 48.4% | up 29.9% | down 32.9% |
| Intel | down 41.9% | up 19.3% | down 30.7% |
| Micron | down 39.1% | up 17.5% | down 28.4% |
| Lam Research | down 41.8% | up 23.4% | down 28.1% |
| Entegris | down 41.8% | up 40.4% | down 18.4% |
| Monolithic Power | down 26.1% | up 12.3% | down 17.0% |
| Semis, cap-weighted | down 24.6% | up 13.6% | down 14.3% |
| Broadcom | down 25.2% | up 15.4% | down 13.6% |
| NVIDIA | down 19.4% | up 14.5% | down 7.7% |
| S&P 500 | record close set August 7 | down 0.3% | |
Every semiconductor row is still below its 2026 peak, and nine of the eleven are lower than they were at the August 7 close — the two exceptions, Lam Research and Monolithic Power, are flat to within a twentieth of a percent. The index slipped 0.35% from Friday's record close over the same window, while Intel gave back 3.88% and the equal-weighted basket 2.67% — so the divergence this letter is built around widened. Tuesday itself cut the other way: nine of the eleven semis rose on the day — Entegris up 4.16%, Marvell up 1.80%, ON Semiconductor up 1.67%, with only Broadcom (down 1.50%) and NVIDIA (down 0.02%) falling — while the index slipped 0.32%. The July 29 lows have held everywhere, which keeps the bottom calls alive. The arithmetic the year-end call requires: +16.7% on the cap-weighted basket, roughly +66% on the worst-damaged name, inside five months.
Which call fits the evidence best right now? Not the loudest one.
Judged strictly on the shape of this week, the best-fitting call on our ledger belongs to Quinn, who wrote it before the bounce, on July 31: a leverage-induced blowoff whose buyer base is too damaged to repeat it, resolving into low-volatility chop, not a V — and four sessions of exactly that chop is what the market has now printed. One number of his we flag against our own table: he says semis need a double to reclaim their highs; our arithmetic says +16.7% for the basket, though the worst names — at +65% to +66% (ON Semiconductor and Applied Optoelectronics respectively) — are within sight of his framing. The starkest call stays open too: Jared Dillian's August 5 read that the Fed-day crash and the liquidation were the starting gun of a bear market, analogue February 27, 2007. And the calendar is doing quiet work that most commentary misses: no-new-highs-within-weeks and new-highs-by-year-end can both come true. On a five-month clock those camps are arguing about the route, not the destination — a destination that picked up a second, independent vote this week, with Steno expecting another euphoric market before New Year's from macro reasoning that shares nothing with the AI bulls' case. Only the bear-market call is mutually exclusive with the rest. Nothing resolved this week; the needle moved toward chop.
Memory versus GPUs: the collision
The sharpest AI-trade voice of the week is exiting Micron, rotating the proceeds to metals. The sharpest macro voice argues the exact opposite side of the same trade: memory chips are currently more valuable than GPUs — Samsung is set to print more than $1 trillion of free cash flow over three years, roughly its entire market capitalisation, about 75% of 2027 hyperscaler capex goes to memory — and the market's habit of pricing memory as the cyclical laggard is wrong, right down to the assumption that NVIDIA is a far more stable business than the memory names. The market currently sides entirely with the exit: Micron sits 28.4% below its high, NVIDIA 7.7%. If Steno's argument is right, that 21-point spread is the mispricing; if the exit is right, it is fair. What settles it — memory pricing through the 2027 capex cycle — is on both men's record, dated.
4The long end is the real risk — and one number this morning stresses every position
The deepest threat to everything above is not in semiconductors. The 30-year Treasury yield has gone from 4.02% to 5.27% — up 125 basis points while the Federal Reserve was cutting, the largest such move in forty years, and the claim Jim Bianco argues harder than anything else he said this month: the long end is not following the Fed, it is pricing inflation against it, and another cut sends the 30-year toward 6%. This week added an independent second route to the same cliff, via the currency: if yen intervention fails — Brent Johnson's August 9 scenario has it failing to 200, then 300 to the dollar, “not in a straight line” — then rising US yields strengthen the dollar, squeeze Japan's roughly $3.5 trillion of foreign assets toward fire-sale, and push yields higher still. Two mechanisms, one conclusion: the long end is the pressure point.
The counter-position is reflation, and it is why the metals trade in section 3 exists at all: a deficit running 5–6%, thirty-year yields at twenty-year highs, and yen intervention itself read as proof the toolkit is empty — from which the reflationists conclude “they can't let bonds fall — they must reflate and print,” and buy hard assets and equities while avoiding bonds and cash. That is Visser's stated book. Note the precise hinge between him and Bianco, because it is narrower than it looks: the disagreement is whether the cut ever comes. Bianco's 6% scenario fires on another cut; the reflation book assumes the Fed has no choice but to hold. And the labour data cuts against the hold: aggregate payrolls on a six-month rolling basis the weakest since 2012 excluding COVID, wages at 3.2% year on year. A labour market like that is the textbook argument for cutting — which makes “the Fed holds” the load-bearing assumption of the whole reflation structure, and the first thing we are watching for cracks.
Which brings us to the number that lands while you read. The most immediately gradeable call on our ledger is Steno's August 11 nowcast: this morning's US CPI comes in soft — headline 0.1% month over month, core 0.2%, below consensus — part of his broader case that the Fed should cut, not hike: no case for a hike that he can see, September staff projections due to soften with oil far below the roughly $115 they assumed, and tariff money now being paid back to corporate America removing the urgency to raise prices. Line up the three exposed positions: a soft print strengthens the case for cutting; a cut is the act the long end is said to punish; and the reflation book assumes it never happens. One data release, three positions on our ledger leaning on it in three different directions.
One amplifier worth logging beside it: Michael Howell's August 9 finding that global liquidity drives roughly 45% of crypto's variation, with crypto about 8x sensitive to liquidity against roughly 2x for gold and silver. It explains both halves of a detail in our scorecard: why a reflationist holds Bitcoin next to silver, and why Bitcoin whipped down 1.87% this week while silver rose — the high-beta leg of the same trade, swinging harder while the question is open.
5The Delta this week
What moved on our board as the week's claims settled in — direction stated in words, largest move first:
- Frontier AI labs: down 33.6 points — the largest move on the board, and a striking one against a week when the infrastructure argument got louder. The board distinguishes the builders from the labs; this week the voices did too.
- Copper: up 29.9. Space: up 22.9. Oil & energy: up 15.3, into Bullish.
- US dollar: down 19.0. Inflation-versus-deflation: down 15.8, into Bearish — the board leaning toward the inflationary read.
- Valuation & bubble risk remains the most bearish standing topic on the board, unchanged in rank.
Read the cluster together and it rhymes with the scorecard: hard assets and energy up, the dollar down, inflation worries rising, the labs de-rated while the builders hold. The board reached the same tilt as the rotation in section 3, from independent inputs — which is either corroboration or a crowd forming, and we will know which by watching who gets there next.
6One insight: the reported number and the real number are different things
This section is a thesis, and everything in it is evidence for the same sentence: the number you are shown and the number that is true have quietly come apart, and the market keeps rewarding the wrong one.
Watch it at company scale first, in a pair of moves from the hyperscalers' own accounts. Microsoft extended its server life from 15 to 25 years and shifted capex from operating to financial lease — a change that flatters reported earnings while, on Steno's reading, hiding the spend and weakening credibility — and the market celebrated. Alphabet shortened its server-park depreciation, a change that raises earnings quality, and the market punished it. Opposite moves, opposite honesty, and the rewards went backwards both times.
Now the same disease one layer down, in the data itself. If you screened US large caps for free-cash-flow yield last week, roughly four in ten of your inputs were wrong. We measured the capital-expenditure field across 3,504 payloads from the kind of fundamentals feed that sits behind most screeners, most research pages and most stock apps. It is corrupt in 40.9% of them — wrong sign, exact zeros, values a small fraction of depreciation, three-year swings with no event behind them.
That one field decides free cash flow, which is operating cash flow minus capital expenditure, which is the most persuasive number on any research page. Watch it hit a real company — AEP, where one payload carries two separate defects. In the annual series, the feed kept the line “Acquisitions of Nuclear Fuel” — −$130M — while dropping the line that mattered, “Construction Expenditures” at −$8,453M. How do we know that was a capture failure rather than a bad estimate or a definitional quirk? Because the same feed got the same company right, twice, and we can reconcile it to the dollar. In FY2023 the payload's capex was $7,506.5M against $7,506.0M of filed Construction plus Nuclear Fuel; in FY2024, $7,770.6M against $7,771.0M. Both years, the feed correctly summed both lines. In FY2025 it reported $130.0M — only the small line — and an $8.45bn item silently fell out of the arithmetic.
The trailing-twelve-month block — the one the published yield is computed from — has a different defect: it adds capex where a subtraction belongs. The receipt is in the payload's own per-share fields: operating cash flow $13.99, capex $2.47, free cash flow $16.46. That is 13.99 plus 2.47, exactly. The tell is the payload's own ratio field, which reports free cash flow at 117.6% of operating cash flow — free cash flow larger than the cash flow it is derived from, which is arithmetically impossible if anything was subtracted. Stack the two defects and the published free-cash-flow yield came out at 12.81%. The filed figure is −3.35%. A utility in the middle of a heavy build, consuming cash exactly as you'd expect, screened as one of the highest-yielding names in the index — and nothing in the presentation would tell you. DLR is a third failure mode at full scale: capex reported as zero against $3.18bn filed, so free cash flow came out at positive $2,412M where the filed arithmetic gives negative $769M.
It is why all 208 of our deep dives were rebuilt against the SEC filings themselves this week — and in 153 of them, a filing contradicted the feed and the dive was re-struck on the filing. Where a company's own 10-K disagrees with a vendor, the 10-K wins and the page says so.
— MEMBERS ONLY BELOW THIS LINE —Free readers: upgrade for the positions, the entry logic and the graded calls · $19/mo or $199/yr
7Portfolio corner
The rebuild produced 29 names at Buy — Tactical and zero at Buy — Core: once the dives ran on filings instead of the feed, no business cleared the long-horizon bar at current prices.
Eli Lilly (LLY) is the call worth walking through. The dive published Tuesday, August 4, with the stock at $1,116.11, a base-case fair value of $1,220, and a verdict of Buy — Tactical. It carried a dated, explicit instruction: buy roughly a third of the intended position before Wednesday's earnings, hold the rest for after. That's the opposite of conviction sizing — it's a way of being wrong cheaply if the print goes against you, while still holding something if it doesn't. LLY closed August 7 at $1,185.71, up 6.24% over its first four sessions; across all 29 Buy-tier names the mean move over the same window was up 1.42%, 22 up and 7 down. The staging rule — not the outcome — is the part that survives scrutiny: it loses a third of a position instead of a whole one when the print goes the other way.
The freshly rebuilt Crypto book reads down 9.63%, with 98% of the book priced; one holding, GEOD, currently has no available price.
8The open ledger
Nine dated, falsifiable calls, ours included — each graded here when its own clock runs out:
- This morning's CPI prints soft — headline 0.1% month over month, core 0.2%, below consensus (Steno, August 11). Resolves today, as you read.
- GPU rental prices keep rising into renewals (Baker, August 4). Resolves as contracts renew over the coming quarters.
- Hyperscaler operating cash flow keeps accelerating (Baker, August 4). Resolves each earnings season, quarter by quarter.
- The July 29 lows hold, and a follow-through day confirms an investable rally (Visser, August 2). His stated window — days four to ten off the low — is live now.
- Many AI names make new all-time highs by year end (Visser, August 8). Resolves December 31; the bar is +16.7% on the cap-weighted basket, up to roughly +66% on the worst-damaged name.
- No new all-time highs in semis within weeks; low-volatility chop (Quinn, July 31). On its stated clock of weeks; four sessions of chop fit it so far.
- The crash was the starting gun of a bear market (Dillian, August 5). Judged over quarters; the longest clock on the board, and the only call here that cannot coexist with the others.
- Another euphoric market before New Year's (Steno, August 11). Resolves December 31 — the independent macro route to the year-end bulls' destination.
- Ours: the 29-name Buy — Tactical tier and the LLY staging rule (August 4). Tactical horizon of months; reported weekly.
The first resolution lands this morning, shortly after this email does. Next Wednesday we print what happened, whichever way it went.
See you next Wednesday. If a number in here is wrong, tell me and the correction runs at the top of the next one.
— Ari
Read this week's dives on the site →
Synthos Research · Ari @ Synthos Research · independent research · educational only — not investment advice, and not a recommendation to buy or sell any security · every claim dated and attributed; every call logged and graded in public, misses included · no live performance track record yet — short-window figures are labelled as such · you're receiving this because you subscribed at synthosresearch.com · unsubscribe anytime.